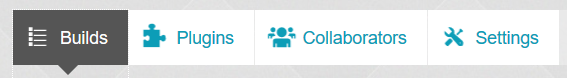
You have to click on the app's name to drill down to the detail page. Four main tabs are added for advanced control:
- Builds (default)
- Plugins
- Collaborators
- Settings
Builds Tab (default)
The Builds tab allows you to:
NOTE: You will need signing keys for iOS and Windows; otherwise, you will get the red Error button. However, Android uses a debug key to create the app so that is why you see the apk button. However, you will still need to create a release key to use for the app store.
- Review app settings (App ID, Version, Owned by, PhoneGap(iOS / Android / Windows), Source and Last built (x) date.
- Add or change a key for any of the OS builds from the drop-down menu.
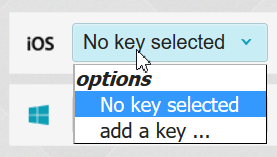
NOTE: You don't need a key for the debug version of an Android app. However, you do need to include one for the release version
- Rebuild apps separately by clicking on an OS button (e.g., iOS, Android, Windows Phone).
- Review the log file for each OS build
- Download compressed app if it does not show an error (like the iOS button below) to your computer.
- .ipa - iOS app extension
- .xap - Windows Phone app extension
- .apk - Android app extension

Plugins Tab
A plugin is add-on code that provides JavaScript interface to native components that allow an app to used native device capabilities (e.g., camera, phone) beyond what is available to a web app.
PhoneGap Build comes with host of core plugins that have device-specific capabilities that can be accessed from within an app onto the native device.
| Accelerometer | Connection | File | Notifications |
| Camera | Contacts | Geolocation | SplashScreen |
| Capture | Device | Globalization | Storage |
| Compass | Event | Media | Whitelist |
Each plugin has to be defined in the config.xml file with the <plugin> element using the name, src and spec (version) attributes. If you don't set the spec attribute, the app will always be built with the latest plugin version. The source attributes includes npm (default), pgb (phonegap build), or git.
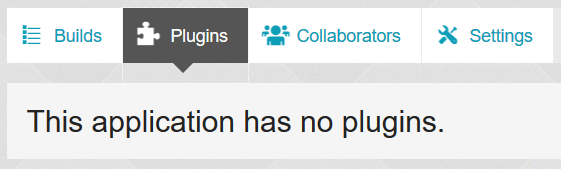
If you don't have any plugins, you get a message stating "This application has no plugins."
- Add the required plugins in the config.xml file. For example, if you want to add the following plugins, type the following code in the config.xml file.
NOTE: Adding these plugins to the configs.xml file will:
- add them to the build process for Android, iOS and Windows
- be available when you click the plugins tab
- will show premissions to inform users of these plugins
However, code still needs to be written access their functionalities.
CAUTION: If you see a plugin with "org.apache.cordova", this is an outdated plugin. It should be name cordova-plug-in-[pluginname].
<plugin name="cordova-plugin-camera" spec="~2.1.1" source="npm"/>
<plugin name="cordova-plugin-device" spec="~1.1.1" source="npm"/>
<plugin name="cordova-plugin-dialogs" spec="~1.2.0" source="npm"/>
<plugin name="cordova-plugin-geolocation" spec="~2.1.0" source="npm"/>
<plugin name="cordova-plugin-inappbrowser" spec="~1.3.0" source="npm"/>
<plugin name="cordova-plugin-network-information" spec="1.2.0" source="npm"/>
<plugin name="cordova-plugin-splashscreen" spec="~3.2.1" source="npm"/>
<plugin name="cordova-plugin-statusbar" spec="~2.1.2" source="npm"/>
<plugin name="cordova-plugin-whitelist" spec="~1.2.1" source="npm"/>
<plugin name="phonegap-plugin-barcodescanner" spec="4.1.0" source="npm"/>
- After making changes to the config.xml file, rezip the needed files again and upload the zip file to PhoneGap Buils and rebuild the app again (See Upload To PhoneGap Build under the Deploy & Test menu for details)
- Click the app title to open the Detail page.
- CHECK POINT: Click the Plugin tab and you should see all of the plugins that you added to the config.xml file.
[ADD MY OWN SCREEN SHOT LATER]

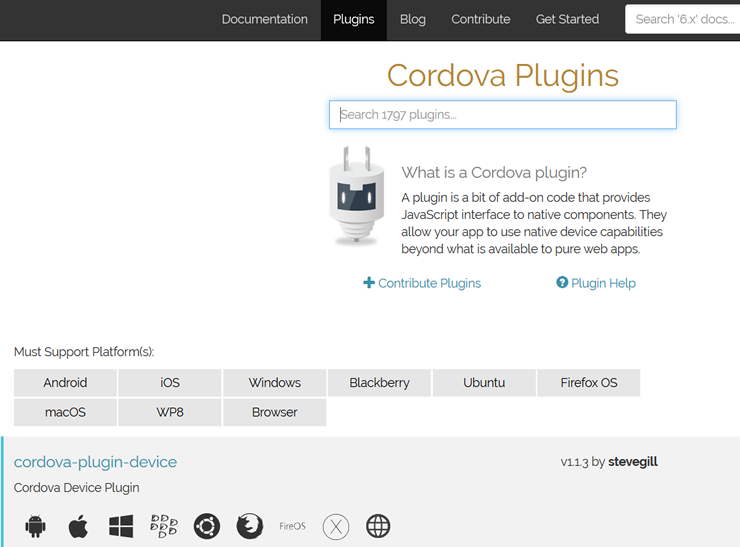
Available Plugins
You can to go to the Plugins page where you can peform a host of plugins related actions.
- Click the Plugins link at the top of the screen or go to https://build.phonegap.com/plugins/ to perform one of the following:
- Search For Plugins
- Core Plugins
- Old Plugins
- Your Plugins
- Submit Private Plugin
- Click the Search For Plugins tab to Search for a specific plugin by name and other criteria (e.g., npg, cordova.apache.org, github.com).

NOTE: You can click on the Search on cordova.apache.org button to go to the Cordova website for a list of third-party plugins. Some of the most popular third-parties plugins include notification, barcode, social media, etc..
- Click the Core Plugins tab to see a list of core plugins with the plugin names and the xml code snippets for each plugin that you can include in the config.xml file:

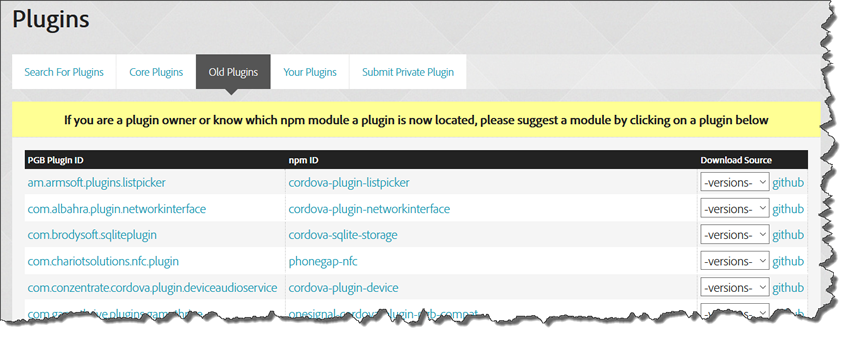
- Click the Old Plugins tab to see a list of old plugins:
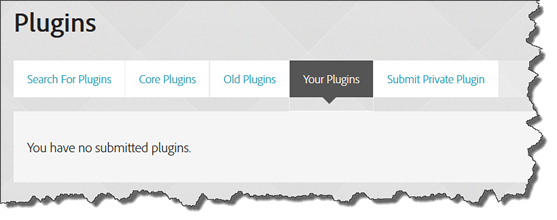
- Click the Your Plugins tab to see a list of you plugins, if any. Otherwise, you will see the following screen:
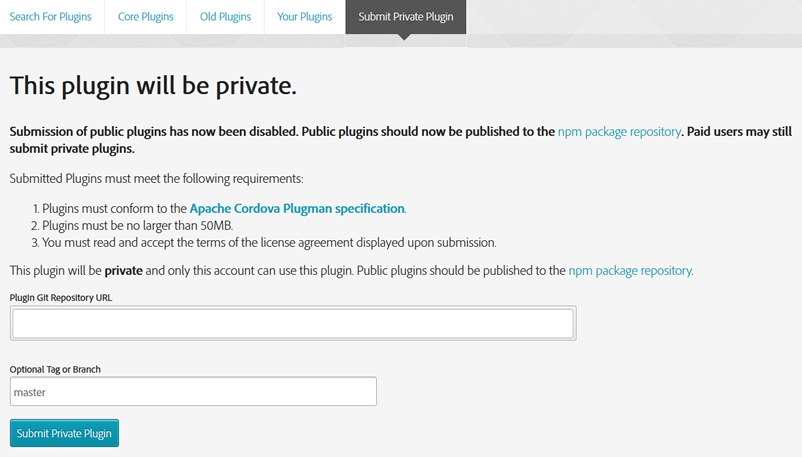
- Click the Submit Priviate Plugin tab to see a list of old plugins:
Example Code for Plugin
Below is an example of some prototype code for barcoding. The barscan plug has already been added to the config.xml file. Now we need to write some JavaScript code to access it.
- Create a JavaScript file and name it app.js in the js folder of your site and then write the following code:
[CHANGE CODE LATER TO MY OWN CODE]
document.addEventListener("deviceready", onDeviceReady, false);CODE EXPLANATION:
function onDeviceReady() {
$( "#qrScanBtn" ).click(function() {
doScan();
});
}
function doScan(){
cordova.plugins.barcodeScanner.scan(
function (result) {
alert("We got a barcode\n" +
"Result: " + result.text + "\n" +
"Format: " + result.format + "\n" +
"Cancelled: " + result.cancelled);
},
function (error) {
alert("Scanning failed: " + error);
}
);
}
- Similar to a document.ready method, the deviceready method is "listen for" and then the onDeviceReady() method is invoked. One the scan button is clicked, it in turn invokes the doScan method that execute a function is successful and returns Result, Format and Cancelled. Otherwise, if there is an error, an error message is displayed.
Collaborators Tab
The Collaborators tab allows you to:
Grant different access privileges to app developers or testers by:
- Click the Collaborators tab.

- Specify an email address, a role and then click the Add button:

NOTE: A Tester has only read-only access; whereas, a Developer has read/write access. Either one will need to have a PhoneGap account. The tester or developer will receive an invitation to test or work on the app from the PhoneGap Build interface. Testers can only download the app. Developers can modify, rebuild or delete the app, manage signing keys, or add other collaborators. As the account owner, you can edit or delete the collaborator at any time.
Settings Tab
The Settings tabs allows you to set basic settings, configuration settings, and delete an app
BASIC SETTING:
- Browse and upload a new version of the app
- Enable or disable debugging
- Enable or disable Hydration
- Enable or disable Private application
- Allow Public Sharing
- Delete App (In Danger Zone)
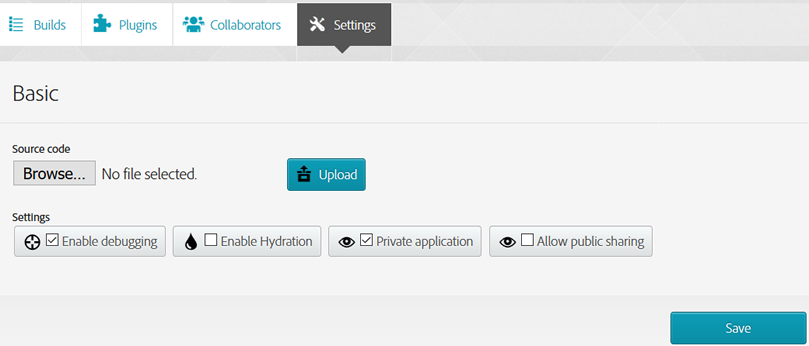
- Enable Debugging - allows you to inspect your app while it's running on your device.
- Enable Hydration - allows PhoneGap to wrap app in a native compiled binary to speed up compile times. It also notifies users when an update is ready.
- Private application - makes the app private instead of public.
- Allow public sharing - allows the app to be shared with others outside of collaborators list. This will create a PUBLIC link near the QR code that will allow ANY mobile user to install the app directly on user's device.
- Click the Save button and PhoneGap will rebuild the app into each of the OS's.
CONFIGURATION SETTINGS:
The Settings tabs also allows you to set a FEW configuration settings.

- Icon file (.png) - browser to icon file
- app title
- Package
NOTE: This is a unique ID that uses reverse domain notation (e.g., com.mycompanyname.myappname) and should match the app ID of the iOS certificate that was created)
- Configuration version (You can change the PhoneGap version that is used to compile the app) description
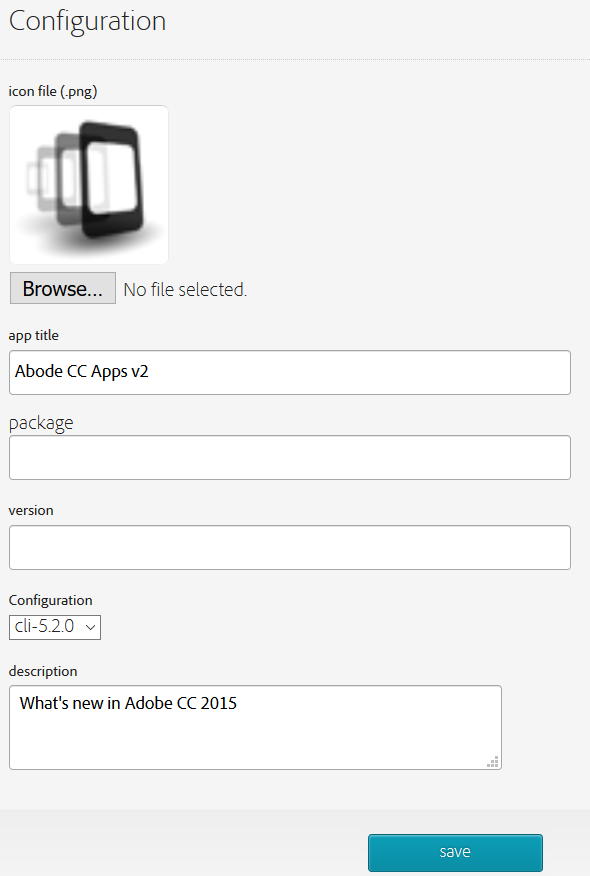
- Click Save button and PhoneGap will rebuild the app into each of the OS's.
NOTE: To set additional configuration settings, See Create Config.xml File in the menu for details on how to create a custom config.xml file.
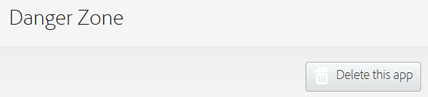
DELETE AN APP (Danger Zone):
If you need to delete an app, click the Delete this app button and then press Yes to confirm the deletion.
Debug Builds (Advanced)
There are several ways to debug your app:
- PhonGap Build weinre
- Chrome Developer Tools
- Safari Developer Tools
- GapDebug (Third party)
PhoneGap Build (Weinre)
PhoneGap Build through an online debugging tool called weinre supports a scaled-down version of the web inspector tools found in Google Chrome or Safari to resolve common debugging issues.
Before you start debugging your app you have to first enable it in PhoneGap Build so that it can create a debug version of your app:
- Click the app name on the main page of the PhoneGap Build website.
- Click the Settings tab on the Detail Page.
- Select the Enable debugging checkbox.
- Click the Save button.
- With the device connect to your computer, click the Debug button:

NOTE: PhoneGap Build will recompile the app using a debugged version for each platform.
- Click the Target Link
[REPLACE WITH OWN TARGET LINK LATER]

- Click the Elements tab to get direct access to a device to see its HTML, CSS and JavaScript. The Elements tab allows you to view the app's full DOM tree as it executes.
- Click other tabs as needed:
- remote tab shows remote resources
- network tab shows network requests
- timeline tab shows component resources load times
- resources tab allows for inspecting databases, local and session storage
- console tab allows you to enter code
This interface can be used to modify an app as it runs. For example, you could select an element from the DOM in the debug view to have it highlighted on the device view. Or, you could select the Console tab and type JavaScript code directly on the command line:
document.querySelector('h2')...
CAUTION: Remember to disable the debugging setting before building a release version of your app. Deselect the Enable checkbox and then click the Save button again to compile a non-debugged version of the app.
Chrome Web Browser (Android)
Since the app is actually in a WebView component, the app can be debug using Google Chrome remote Developer Debugging tools (e.g., https://developer.chrome.com/devtools). This only works in debugging mode and not release mode.
- Connect device to your computer via a USB cable.
- CHECK POINT: On your computer, open Google Chrome and in the URL field enter chrome://inspect and then press the Enter key. You should see the following screen and ensure the Discover USB devices checkbox is selected.
[REPLACE WITH OWN TARGET LINK LATER]
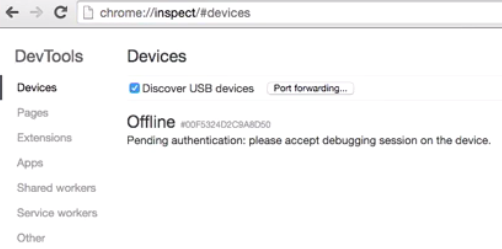
- CHECK POINT: Click OK when your device prompt you to allow USB debugging from your computer. Optionally, select "Always allow from this computer." and you should see your device gets listed (e.g., Nexus 5) with the name of your app listed.
- Run the app on your device and then click the Inspect link on your computer to open the Chrome Developer Tools.
- Click on elements on the right panel to inspect element in the left panel like a regular web site. You can also use the JavaScript panel, CSS, etc.
Safari Web Browser (iOS)
Likewise, iOS devices can be debugged using Apple Safari.
- On the iOS device, go to Settings and select Safari. Ensure that Private Browsing is turned off??
- Scroll to the bottom of the screen and then click the Advanced option.
- In the screen that appears, turn on the Web Inspector option.
- On your Mac, open Safari and select the Preferences... menu.
- With the Advanced tab selected, ensure that the Show Developer menu in menu bar is selected.
- From the menu, select Developer > [Your Phone Name] > index.html.
- In the Web Inspector Tool dialog box that appears, use it to inspect your HTML, CSS, JavaScript, etc.
NOTE: There are some differences between the web Inspectors, for detail go to Google Chrome or Apple Safari.
GapDebug
GapDebug from Genuitec is a free comprehensive mobile debugging tool for both the Windows and Mac platforms that allow you to debug hybrid mobile apps created with PhoneGap Build for iOS and Android devices.
- Go to http://www.genuitec.com/products/gapdebug and click the Download GapDebug button to install GapDebug.
NOTE: GapDebug has to advantage of debugging an iOS app on Windows.
- Connect device with a USB cable and then perform debugging.
Hydration (Advanced)
Hydration is used to get faster debug and build cycles. With Hydration, updates to an app can be pushed directly to a testers' previously installed apps, ensuring everyone is working on the most up-to-date version.
Instead of having to completely recompile an app after every change, hydration instead creates a special native binary container for an mobile app. When the app's launched on a device, it checks with the PhoneGap build servers, to see if there's a new version of the app available. If there is, the app can be updated WITHOUT being reinstalled. To enable this feature, again on your app setting page enable hydration.
- Click on the app's title to go to the Detail page.
- Select the Enable Hydration checkbox.
- Click the Save button.
WHY: To have PhoneGap build recompile the app with the hydration capabilities enabled.
- If a user decides to update an application, the new build will be downloaded and executed.
- If a user decides to skip the update, the app will stay at the current build and the user will be prompted to update on the next restart.
- If a non-Hydratable build is generated by a developer, the user will need to obtain a new version of the compiled binary. The user can obtain the binary by downloading it or by using one of the other methods.
Disable Hydration
- Log into the apps page.
- Select your app and click its title or icon.
- On the app's Detail page, click the Settings tab.
- Deselect the enable hydration checkbox.
- Click the Save button.
NOTE: Users will now need to download updates to app manually again.
CAUTION: Ensure this feature is disabled when you build your release version of your app.